Retail food environments contribute to rising levels of obesity as they set the context within which people acquire food by providing opportunities and constraints that are related to food purchasing decisions. As the obesity rate continues to increase in the U.K., inequality in food access was identified as a major cause of the obesity pandemic. However, the U.K. lacks the data to monitor food access at the community level that could help identify disadvantaged area that bars the population from pursuing healthier diet.
Across the pond, the USDA is tasked to define a methodology to map food deserts in the US and identify them. Lending from its definition of food deserts, I experimented with four different specifications of food access indicators at the MSOA level were proposed for the context of the U.K. using open-source data as follows:
- Number of supermarket outlet
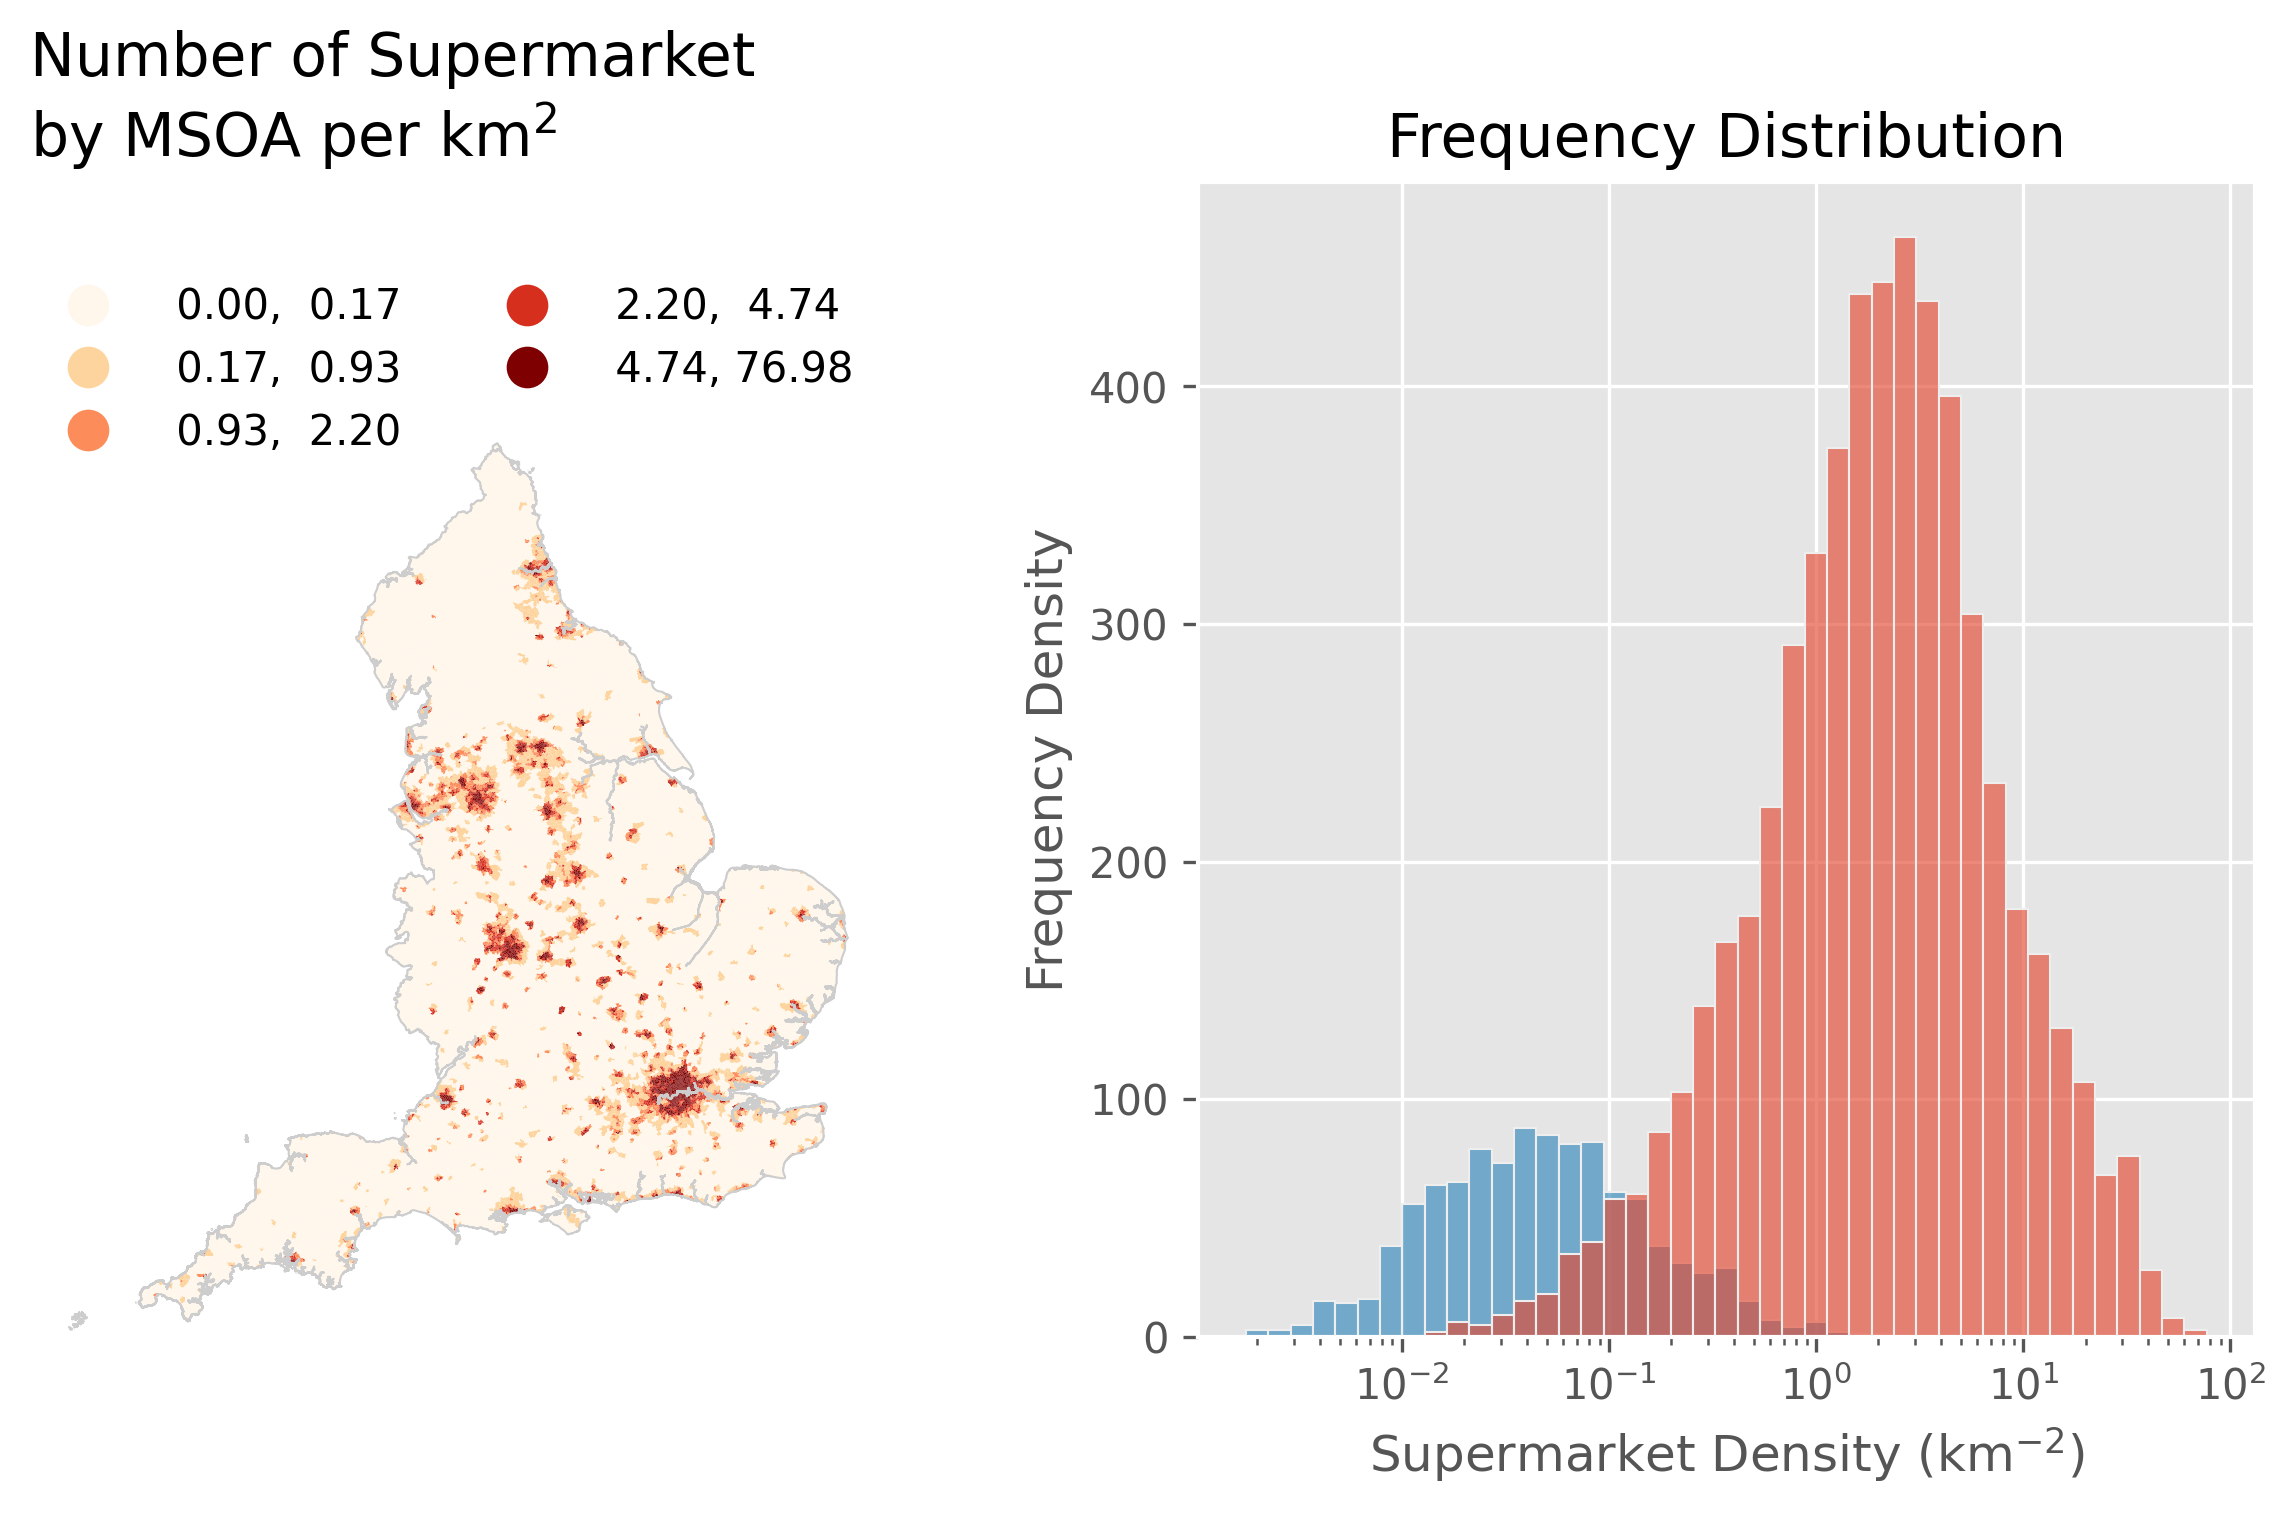
- Number of supermarket outlet per squared area
- Average Supermarket Kernel Density Estimate (KDE) in Residential Area
- Percentage area within 1km/5km radius of a Supermarket
While the indicators specifed by the first two methodology easy to derive, they are rudimentary and introduce bias to the measure, such as the rural-urban divide. However, they are not alone in this respect as the third methodology also do not distinguish between rural and urban area. Comparing the histogram below showing the number of MSOAs across the food access spectrum suggests that the KDE method is not any better at overcoming the bias of rural-urban divide.

With the last method where the rural-urban area are inherently distinguished in the indicator derivation similar to that of the USDA method, the distribution of MSOA between urban and rural group are closer to identical as shown by the historgram that follows. However, with the spatial distribution of the population, this is only achievable with the threshold of 1km for urban area and 5km for rural area in England’s context as opposed to 1 mile and 10/20 miles in the US respectively.

Although the KDE method has built in the complexity to distinguish between built-up area and non-residential area to better capture individual food access, it would require further work, particularly in terms of the method to distinguish between rural and urban area while considering the inherent divide between the two broad group of area in terms of population density and acess to service.
Author’s Note:
Much of the content in this article is adapted from the text submitted as part of the author’s dissertation for Geospatial Data Science. For detailed methodologies of the production of the map, including the data source and manipulation, you can visit the respective GitHub Repository for details.